HISTORYLIBRARY 역사문화라이브러리
신동훈의 사람, 질병, 그리고 역사
학술발표: 최근 제기된 일본인 기원의 3중 구조론에 대해by 응도당 2023. 4. 7.
토요일에 아래와 같이 학술발표를 합니다. 많은 참여 부탁드립니다.
한일관계사학회 제206회 월례발표회(2023.04.08) : 월례발표회 및 학술대회 - 한일관계사학회 (hanilhis.or.kr)
한일관계사학회 제206회 월례발표회(2023.04.08) : 월례발표회 및 학술대회 - 한일관계사학회
【한일관계사학회 제206회 월례발표회】
■ 제1주제 : 최근 제기된 일본
hanilhis.or.kr
*** Editor's note ***
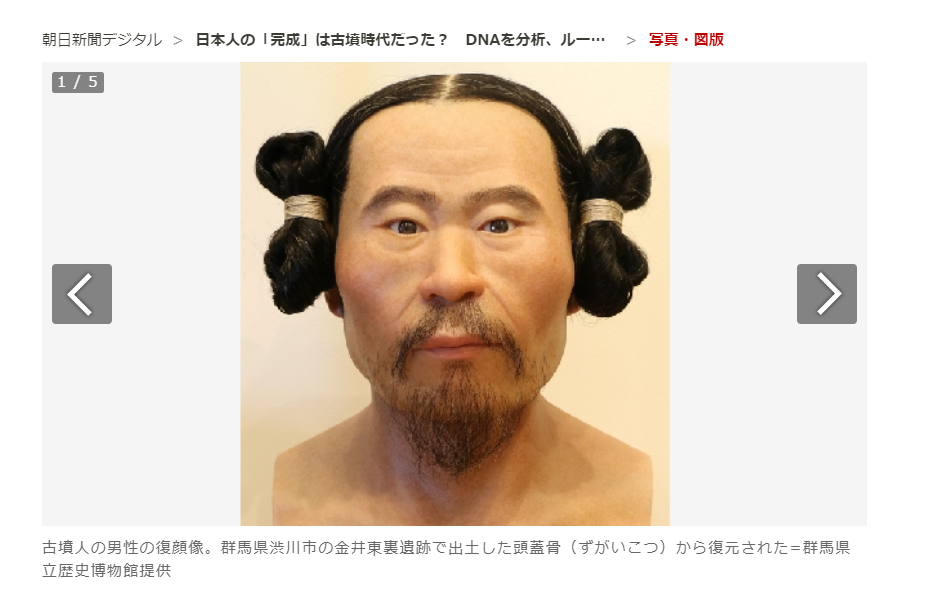 근자 이런 복원이 유행이라, 이 분이 일본분이시라고
hanilhis.or.kr
*** Editor's note ***
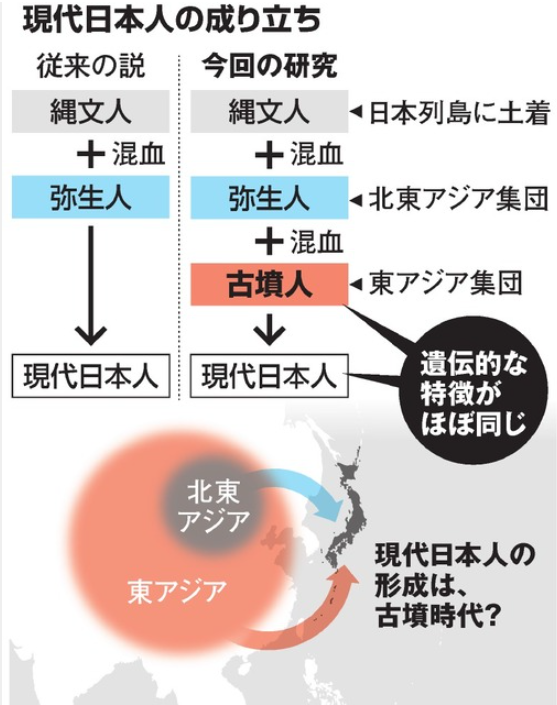
근자 이런 복원이 유행이라, 이 분이 일본분이시라고이것이 근자 제기된 삼중기원론이다. 조몽인에다가 야요이인, 그리고 고분시대 외래인 삼중이 토대가 되어 현대 일본인이 성립했다는 구조다. 무시할 수 없는 까닭은 DNA 연구성과를 반영하기 때문이다.
===
===
Yuik Kim
35 m ·
일본 리버럴의 민족주의
동아시아인들에게는 누구에게나 민족주의의 감정이 있다. 리버럴한 일본인들은 쏘쿨해서 민족주의를 예전에 졸업했다고 생각하시는 분들이 많은 것 같은데, 절반만 맞는 얘기다.
나는 식민지 근대화론에 찬성하지 않지만 한국이 2000년이전까지 일본을 통해서, 혹은 일본인과의 협력을 통해서 현대한국의 산업화를 이뤘다는 것은 인정해야 한다고 생각한다. 그게 서구문명이지만 여하튼 우리는 일본을 거쳐서 받아들였다. 그런데, 지금의 한국인들은 그 일본을 "바이패스"하고 싶어한다.
그런데 흥미있는 건 일본인 엘리트들에게도 (일본의 보통사람들은 한국과 중화권 사람들에 비하면 기본적으로 중앙정치와 국제관계에 대한 관심 자체가 적다) 똑같은 경향이 있다는 것이다. 그건 고대사 문제이다.
일본은 수렵채집생활을 하는 원주민 위주였던 조몽시대를 거쳐 야요이시대에 쌀농사를 시작하고, 고분시대에 고대국가를 만들기 시작했다. 야요이시대부터 이런 진보에 결정적인 기여를 한 것은 대부분 한반도에서 건너간 소위 도래인들이다. 사실 일본의 도래인들과 당시 한반도 남부사람을 인종적으로 구분하는 건 의미가 없을 것이다. 그리고 서로 계속 내왕하고 있을 가능성도 높다. 그러니까 한반도에서 건너갔다고 해서 한국인이 조상, 원조, 선생님... 한국인들이 이런식으로 생각하는 것도 당연히 옳지 않다.
아래 링크를 한 내용은 2021년에 아일랜드의 (일본인이 참가한) 분자유전학 연구팀의 사이언스지 논문이고, 그런 가설들을 뒷받침한다.
https://www.science.org/doi/full/10.1126/sciadv.abh2419...
https://www.science.org/doi/full/10.1126/sciadv.abh2419?fbclid=IwAR1ib5LbNO5L7v4tnhhxPaoex_J5KiXoG1MPI2FeAuDWFyQ1sEzdH0CYs2c&mibextid=ykz3hl
그런데 일반적으로 일본인들은 굳이 도래인들이 중국대륙에서 왔다고 표현을 한다. 한반도를 "바이패스"하고 싶은 것이다. 위의 연구내용을 보고도 심지어 어떤 일본지식인들은 고분시대의 사람들은 중국의 삼국시대 오나라가 멸망한 후 장강하류유역에서 직접 일본으로 배를 타고 건너왔을 것 같다고 말한다. 가소로운 이야기이다. 심지어는 야요이 시대에 쌀농사를 전파한 사람들도 바로 장강유역에서 직접적으로 일본으로 건너왔다가 다시 한반도로 전해줬을 것이라는 주장을 하는 사람들조차 있다. 그런데 극우가 아니라 리버럴한 생태주의자들중에도 이런 이야기를 하는 사람들이 있다. 원로 활동가/지식인들중에서.....
물론, 어떤 시기든 대륙에서 직접 건너온 사람들도 없지는 않았을 것이다. 하지만, 상식적으로 판단하건데, 당시의 항해기술 수준을 생각한다면 이들 대부분은 한반도를 통해서 건너갔을 확률이 높다. 여기서 "통해서"라는 말은 최소한 몇세대를 거친 후의 사람들이라는 이야기이므로, 도래인들은 사실 한반도인이라고 보는 것이 더 타당할 것이다.
일본인들은 당시의 선진문명을 가졌던 중국대륙사람들이 자신들에게 고급문화를 전파하고 자신들의 조상이 됐다는 것은 받아들일 수 있어도, 기실 그 사람들이 한반도인이었다는 사실은 (중국대륙에서 이주해서 문화도 전파하고 역시 한반도 사람들의 조상이 됐던) 인정하고 싶어하지 않는다. 이건 민족주의가 아니면 뭐란 말인가?
내가 하고 싶은 얘기는 우리 동아시아인들은 어쨌든 모두 마음속 깊은 곳에서는 "민족주의자"이니 나는 쿨한 진보주의자이고 너는 찌질한 민족주의자라는 식으로는 생각하지 말자는 것이다. 영미계열의 진보지식인들이 민족주의에서 상대적으로 자유로운 것은 그 사람들이 원래 쿨해서가 아니라 그들의 역사적 배경과 학문적 전통이 그럴 수 밖에 없기 때문이기도 하다. 그러니까 그 사람들이 우리를 찌질하다고 흉봐도 너무 마음상하지 말자. 그냥 우리는 다른 맥락에서 살아왔기 때문에 다른 현재를 가지고 있는 것이다. 사실 중국의 애국주의나 중화주의도 그런 맥락에서 보면 어느 정도 이해가 된다.
하지만 이렇게 자기객관화를 하는 훈련을 하다보면, 자연스럽게 "민족주의적 아집"에서 벗어날 수 있을지도 모르겠다. 애국주의나 민족주의가 다른 민족과 국가에 대한 차별과 폭력으로 (푸틴과 알렉산더 두긴의 망상때문에 벌어진 러시아의 우크라이나 침략과 같은) 이어지지 않도록 경계할 수 있어야 한다.
====
====
Ancient genomics reveals tripartite origins of Japanese populations
Abstract
Prehistoric Japan underwent rapid transformations in the past 3000 years, first from foraging to wet rice farming and then to state formation. A long-standing hypothesis posits that mainland Japanese populations derive dual ancestry from indigenous Jomon hunter-gatherer-fishers and succeeding Yayoi farmers. However, the genomic impact of agricultural migration and subsequent sociocultural changes remains unclear. We report 12 ancient Japanese genomes from pre- and postfarming periods. Our analysis finds that the Jomon maintained a small effective population size of ~1000 over several millennia, with a deep divergence from continental populations dated to 20,000 to 15,000 years ago, a period that saw the insularization of Japan through rising sea levels. Rice cultivation was introduced by people with Northeast Asian ancestry. Unexpectedly, we identify a later influx of East Asian ancestry during the imperial Kofun period. These three ancestral components continue to characterize present-day populations, supporting a tripartite model of Japanese genomic origins.
INTRODUCTION
The Japanese archipelago has been occupied by humans for at least 38,000 years. However, its most radical cultural transformations have only occurred within the past 3000 years, during which time its inhabitants quickly transitioned from foraging to widespread rice farming to a technologically advanced imperial state (1, 2). These rapid changes, coupled with geographical isolation from continental Eurasia, make Japan a unique microcosm in which to study the migratory patterns that accompanied agricultural spread and economic intensification in Asia. Before the arrival of farming cultures, the archipelago was occupied by diverse hunter-gatherer-fisher groups belonging to the Jomon culture, characterized by their use of pottery. The Jomon period began during the Oldest Dryas that followed the Last Glacial Maximum (LGM) (3), with the earliest pottery shards dating to ~16,500 years ago (ka ago), making these populations some of the oldest users of ceramics in the world (2). Jomon subsistence strategies varied and population densities fluctuated through space and time (4), with trends toward sedentism. This culture continued until the beginning of the Yayoi period (~3 ka ago), when the arrival of paddy field rice cultivation led to an agricultural revolution in the archipelago. This was followed by the Kofun period, starting ~1.7 ka ago, which saw the emergence of political centralization and the imperial reign that came to define the region (1).
An enduring hypothesis on the origin of modern Japanese populations proposes a dual-structure model (5), in which Japanese populations are the admixed descendants of the indigenous Jomon and later arrivals from the East Eurasian continent during the Yayoi period. This hypothesis was originally proposed on the basis of morphological data but has been widely tested and evaluated across disciplines [see a recent review in (6)]. Genetic studies have identified population stratifications within present-day Japanese populations, supporting at least two waves of migrations to the Japanese archipelago (7–10). Previous ancient DNA studies have also illustrated the genetic affinity of Jomon and Yayoi individuals to Japanese populations today (11–15). Still, the demographic origins and impact of the agricultural transition and later state formation phase are largely unknown. From a historical linguistic standpoint, the arrival of proto-Japonic language is theorized to map to the development of Yayoi culture and the spread of wet rice cultivation (6). However, archaeological contexts and their continental affiliations are distinct between the Yayoi and Kofun periods (1); whether the spread of knowledge and technology was accompanied by major genetic exchange remains elusive.
Here, we report 12 newly sequenced ancient Japanese genomes spanning 8000 years of the archipelago’s pre- and protohistory (Fig. 1 and Table 1). To our knowledge, this is the largest set of time-stamped genomes from the archipelago, including the oldest Jomon individual and the first genomic data from the imperial Kofun period. We also include five published prehistoric Japanese genomes in our analysis: three Jomon individuals (F5 and F23 from the Late Jomon period and IK002 from the Final Jomon period) (12–14), as well as two 2000-year-old individuals associated with the Yayoi culture from the northwestern part of Kyushu Island, where skeletal remains exhibit Jomon-like characters rather than immigrant types but other archaeological materials clearly support their association with the Yayoi culture (15, 16). Despite this morphological assessment (16), these two Yayoi individuals show an increased genetic affinity to present-day Japanese populations compared with the Jomon, implying that admixture with continental groups was already advanced by the Late Yayoi period (15). Integrating these Japanese genomes with a larger ancient genomic dataset spanning the Central and Eastern Steppe (17, 18), Siberia (19), Southeast Asia (12), and East Asia (15, 20, 21), our study aims to better characterize the preagricultural populations of the Jomon period, as well as the subsequent migrations and admixtures that have shaped the genetic profile of the archipelago today.

RESULTS
A time series of ancient genomes from pre- and protohistoric Japan
Our initial screening focused on 14 ancient skeletal remains excavated from six archaeological sites across the archipelago (see note S1). High levels of endogenous human DNA were preserved in 12 of these samples (Table 1), which were then further shotgun-sequenced to higher coverage, ranging from 0.88× to 7.51× (Fig. 1 and table S1). Nine of the 12 samples are associated with the Jomon culture, representing the west and central parts of the archipelago and four different stages of the Jomon period (Initial, Early, Middle, and Late Jomon) (Fig. 1). The remaining three samples date to ~1.3 ka ago, falling within the Kofun period. We confirm that all newly sequenced genomes show postmortem damage patterns (fig. S1) and a low level of modern human contamination (<2.15%) (Table 1 and table S2). Our kinship analysis confirms that all pairs of individuals are unrelated (fig. S2). Mitochondrial haplogroups for all Jomon individuals belong to the N9b or M7a clades, which are strongly associated with this population (11–14, 22) and rare outside of Japan today (23). The three Jomon males (table S3) belong to the Y chromosome haplogroup D1b1, which is present in modern Japanese populations but almost absent in other East Asians (24). In contrast, the Kofun individuals all belong to mitochondrial haplogroups that are common in present-day East Asians (25), while the single Kofun male has the O3a2c Y chromosome haplogroup, which is also found throughout East Asia, particularly in mainland China (26). To place our data within the wider context of East Eurasian demography, we combined the ancient Japanese genomes with genomic data from previously published ancient (table S4 and fig. S3) and present-day individuals. Throughout this study, the modern Japanese population is represented by either data from the Simons Genome Diversity Project (SGDP) (27) or JPT (i.e., Japanese in Tokyo) in the 1000 Genome Project phase 3 (28). However, we note that ancestral heterogeneity exists across the archipelago today, which is not fully captured by this standard reference set. Other ancient and present-day populations analyzed in this study are primarily labeled by either geographic or cultural contexts.
Genetic distinction between different cultural periods
We explored the genetic diversity within our time series data by looking at the shared genetic drift between all pairwise comparisons of individuals from both the ancient and modern (SGDP) Japanese populations using the statistic f3(Individual_1, Individual_2; Mbuti) (Fig. 2A). Our results very clearly define three distinct clusters of Jomon, Yayoi, and Kofun individuals, the last of whom group with the modern Japanese individuals, suggesting that cultural shifts were accompanied by genomic changes. Despite the large spatial and temporal variation in the Jomon dataset, extremely high levels of shared drift are observed between all 12 individuals. The Yayoi individuals are most closely related to each other and also have a higher affinity to the Jomon than to the Kofun individuals. The Kofun and modern Japanese individuals are almost indistinguishable from one another by this metric, implying some level of genetic continuity over the past 1400 years.

We further investigated the genome-wide autosomal affinities of our ancient Japanese individuals to continental populations using principal components analysis (PCA). We projected ancient individuals onto the genetic variation of present-day populations in the SGDP dataset from South and Central Asia, Southeast and East Asia, and Siberia (Fig. 2B and fig. S4). We observe that the ancient Japanese individuals separate into their respective cultural designations along PC1. All Jomon individuals form a tight cluster, falling apart from other ancient populations, as well as present-day Southeast and East Asians, suggesting a sustained geographic isolation. The two Yayoi individuals appear near to this Jomon cluster, supporting genetic and morphological similarity to Jomon as reported in (15, 16). However, a shift toward East Asian populations implies the presence of additional continental ancestry in Yayoi. Ancient individuals from East Eurasia show a geographic cline from the south to the north on PC2: Southern China, Yellow River, Northern China, West Liao River, Devil’s Gate Cave, Amur River, and Baikal. The three individuals from the Kofun period fall within the diversity of the Yellow River cluster.
ADMIXTURE analysis with the Human Origins Array dataset also supports the increase in continental gene flow into the archipelago after the end of the Jomon period (Fig. 2C and figs. S5 and S6). The Jomon have a distinct ancestral component (represented in red in Fig. 2C), which is also visible at high levels in the Yayoi and remains at reduced levels in the Kofun and Japanese. New ancestral components appear in the Yayoi, at proportions similar to the profile seen in the Amur River basin and surrounding regions. These include a larger component that is dominant in Northeast Asians (represented by light blue) and another smaller component that represents much broader East Asian ancestry (represented by yellow). This East Asian component becomes dominant in the Kofun period and the modern Japanese population.
Deep divergence of the Jomon lineage by geographic isolation
The separation of the Jomon from other populations (Fig. 2) supports the idea that they form a distinct lineage among East Eurasians, as proposed in previous studies (13, 14). To explore the depth of this divergence, we reconstructed the phylogenetic relationship of Jomon with 17 other ancient and present-day populations using TreeMix with differing numbers of admixture events (Fig. 3A and fig. S7) (29). Our results infer that Jomon emerged after the early divergences of Upper Paleolithic East Eurasians (Tianyuan and Salkhit) and ancient Southeast Asian hunter-gatherers (Hoabinhian), but before the splitting off of other samples including present-day East Asians, an ancient Nepali (Chokhopani), hunter-gatherers from Baikal (Shamanka_EN and Lokomotiv_EN) and Chertovy Vorota Cave (Devil’s Gate Cave) in the Primorye Region, and a Pleistocene Alaskan (USR1). We further confirm the position of Jomon between two other deeply diverged hunter-gatherer lineages in this tree through formal tests of symmetric models using f4(Mbuti, X; Hoabinhian/DevilsCave_N, Jomon) (fig. S8, A and B). These show that all East Asian individuals in our dataset since the beginning of the Jomon period have a higher affinity to Jomon than the earlier diverged Hoabinhian but have a lower affinity in comparison to DevilsCave_N; this supports the inferred phylogeny of three distinct hunter-gatherer lineages in East Eurasia, rather than a previously proposed model in which Jomon is a mixture of Hoabinhian and East Asian-related lineages [f3(Jomon; Hoabinhian, DevilsCave_N) = 0.193, Z = 61.355; table S5] (12, 30). We also consistently infer gene flow from Jomon to the modern Japanese across all migration models tested, with genetic contributions ranging from 8.9 to 11.5% (fig. S7). This is consistent with the mean Jomon component of 9.31% in the present-day Japanese individuals estimated from our ADMIXTURE analysis (Fig. 2C). These results suggest a deep divergence of the Jomon and an ancestral link to present-day Japanese populations.

We apply population genetic modeling to estimate the timing of the appearance of the Jomon lineage. Our approach makes use of genome-wide patterns of runs of homozygosity (ROHs) to identify the demographic scenario that best fits the ROH spectrum observed in our oldest and highest coverage sample, JpKa6904 (see note S2). The distribution of ROH tracts reflects the effective population size and the time to the most recent common ancestor between two copies of haplotypes within an individual (31, 32). The 8.8-ka-old Jomon carries high levels of ROH, in particular with the highest frequency of short ROH (due to population effects rather than recent inbreeding) yet reported (Fig. 3B) (33). This pattern, coupled with strong shared genetic drift among the Jomon individuals (fig. S9), implies that the Jomon population underwent a severe population bottleneck. With a search of parameter space of population size and split time, our estimates place the appearance of the Jomon lineage between 15 and 20 ka ago, followed by the maintenance of a very small population size of ~1000 until at least the Initial Jomon period (Fig. 3C and figs. S10 and S11). This coincides with rising sea levels and the severing of the land bridge to the mainland at the end of the LGM (34, 35) and shortly precedes the first appearance of Jomon pottery in the archipelago (2).
We then asked whether the Jomon had any contact with continental Upper Paleolithic people after the divergence of their lineage, but before their isolation in the archipelago, using the statistic f4(Mbuti, X; Jomon, Han/Dai/Japanese) (fig. S8, C to E). Among the Upper Paleolithic individuals tested, only Yana_UP is significantly closer to Jomon than Han, Dai, or Japanese, respectively (Z > 3.366). This affinity is still detectable even if we replace these reference populations with the other Southeast and East Asians (table S6), supporting gene flow between the ancestors of Jomon and Ancient North Siberians, a population widespread in North Eurasia before the LGM (19).
We lastly investigated potential temporal and spatial variation within the Jomon population. Three temporal groups, defined by the Initial, Early, and Middle-Late-Final stages of the Jomon period, show similar levels of shared genetic drift with ancient and present-day continental populations, implying little or no genetic impact from outside of the archipelago over these subperiods (Fig. 3D and fig. S12). This pattern is further backed up by the absence of any significant gene flow, observed with the statistic f4(Mbuti, X; sub_Jomoni, sub_Jomonj), where i and j are any pairs of the three Jomon groups (fig. S13). These Jomon individuals similarly do not display any diversity in genetic affinity to continental populations when grouped by geography (i.e., different islands on which the samples are located: Honshu, Shikoku, and Rebun Island) (fig. S14). The only observable difference within the Jomon individuals is a slightly higher affinity between sites located on Honshu, implying an insular effect with restricted gene flow between Honshu and other islands (fig. S15). Overall, these results show limited spatial and temporal genetic variation within the Jomon population, supporting the idea of near-complete isolation from the rest of Asia for thousands of years.
Dispersal of paddy field rice farming during the Yayoi period
Two individuals from the southwestern part of the archipelago associated with the Yayoi culture (Fig. 1) (15) were found to have both Jomon and continental ancestry (Fig. 2). Our qpAdm analysis rejected a model in which the Yayoi are unadmixed descendants of the Jomon (P = 0.00003), as opposed to a morphological assessment that groups these two individuals as a part of the Jomon lineage (16). The non-Jomon ancestral component could have been introduced by people who brought rice cultivation to the archipelago. We first tested whether any ancient East Eurasian population has higher genetic affinity to the Yayoi than Jomon using f4(Mbuti, X; Jomon, Yayoi) (Fig. 4A and fig. S16). Most of the sampled ancient populations in the continent do not show significant affinity to the Yayoi, including populations from the Yellow River basin (20) where rice farming first spread from the lower Yangtze Valley (a hypothetical origin of japonica rice, i.e., wet rice) (36). However, excess affinity to the Yayoi was detected in populations who had no cultural relation to rice farming (Z > 3.0): those from the West Liao River basin in Northeast China (WLR_BA_o and HMMH_MN), Baikal (Lokomotive_EN, Shamanka_EN, and UstBelaya_EBA), and Northeast Siberia (Ekven_IA). This affinity is not observable in two more individuals (WLR_BA; Z = 1.493) who came from the same archaeological site as the other Bronze Age West Liao River individual (WLR_BA_o) (20). These two individuals have much higher Yellow River–related ancestry (81.4 ± 6.7%) than WLR_BA_o (1.8 ± 9.1%) (20), which implies that the ancient Yellow River populations tested are unlikely to be a major source of the non-Jomon ancestry carried by the Yayoi.

To further distinguish these six potential sources of continental ancestry, we modeled the Yayoi as a two-way admixture of the Jomon and each in turn using qpWave (table S7). The admixture model was confidently supported (P > 0.05) for three of these: Baikal hunter-gatherers and the West Liao Middle Neolithic or Bronze Age individuals with a high level of Amur River ancestry (20). These groups all share a dominant Northeast Asian ancestral component (Fig. 2C and fig. S17) (20). Admixture fractions of 55.0 ± 10.1%, 50.6 ± 8.8%, or 58.4 ± 7.6% for the Jomon input were estimated by qpAdm when each of these three were, respectively, used as the second source (Fig. 4B and table S7), with a fraction of 61.3 ± 7.4% returned when the West Liao Middle Neolithic and Bronze Age individuals were merged into a single source population (table S7).
We further confirm by f4(Mbuti, Jomon; Yayoi_1, Yayoi_2) that the level of Jomon ancestry is comparable between these two Yayoi individuals (Z = 1.309). These results imply an approximately equal ratio of indigenous hunter-gatherer and migrant contribution to the Yayoi communities associated with this northwestern Kyushu site. This parity is particularly notable when compared to agricultural migrations in western Eurasia, where minimal hunter-gatherer contribution is observed in many regions, including the archipelago of Britain and Ireland (37–40), which mirrors Japan as an insular geographic extreme of Eurasia.
While the West Liao populations used in our admixture models did not themselves practice rice farming, they are situated just north of a hypothesized route of agricultural spread into Japan, to which our results lend weight. This follows the Shandong Peninsula (northeastern China) into the Liaodong Peninsula (northwestern part of the Korean Peninsula) and then reaches the archipelago via the Korean Peninsula (41).
We further investigated how the Yayoi culture spread into the archipelago using outgroup f3 statistics that measured genetic affinity between the Yayoi and each of the Jomon individuals. We find that the strength of shared genetic drift has a significant correlation with the distance from the location of the Yayoi individuals (P = 0.00697; Fig. 4C); the closer the Jomon archaeological sites are to the Yayoi site, the more the Jomon individuals share genetic drift with the Yayoi. This result supports the introduction of rice farming via the Korean Peninsula (41, 42), followed by admixture with local Jomon populations in the south of the archipelago.
Genetic ancestry of migrants during the Kofun period
Historical records provide strong support for continued population movement from the continent to the archipelago during the Kofun period (1). However, our qpWave modeling of the three Kofun individuals rejected the two-way admixture of Jomon and Northeast Asian ancestry that fitted the Yayoi individuals (P < 0.05; table S8). Thus, the Kofun are genetically distinct from the Yayoi in terms of their ancestral components, as supported from our outgroup f3, PCA, and ADMIXTURE clusters (Fig. 2), as well as from previous morphological studies (43, 44). To identify additional ancestral groups that contributed to the genetic makeup of the Kofun individuals, we tested genetic affinity between the Kofun and each of the continental populations using f4(Mbuti, X; Yayoi, Kofun) (Fig. 5A and fig. S18). We find that most of the ancient or modern populations in our dataset are significantly closer to the Kofun than they are to the Yayoi. This finding implies additional migration to the archipelago during the six centuries that separates the genomes from these two periods.

We attempted to narrow the source of this migration by testing the fit of two-way admixtures of the Yayoi and populations identified from our f4 statistics as being significantly closer to the Kofun (table S9). This admixture model was confidently supported with P > 0.05 for only 5 of 59 populations tested. We then applied qpAdm to quantify the genetic contribution from Yayoi and each of these sources in turn (table S9). The two-way admixture model was subsequently rejected in an additional two populations due to a lack of support from different reference sets. The remaining three populations (Han, Korean, and YR_LBIA) show 20 to 30% contributions to the Kofun (fig. S19). These three all share strong genetic drift (highlighted by the green square in fig. S17), characterized with a major component of broadly East Asian ancestry in their ADMIXTURE profiles (fig. S6). To further screen the source of additional ancestry in the Kofun individuals, we tested a three-way admixture by replacing the Yayoi ancestry with Jomon and Northeast Asian ancestry (table S10). Only Han were successfully modeled as a source of ancestry in the model (Fig. 5B), with a significantly better fitting of the three-way admixture than any possible two-way admixture models (table S11). Given that Jomon ancestry is diluted by approximately a factor of 4 between the Yayoi and Kofun populations sampled, these results suggest that the state formation phase saw a large influx of migrants who had East Asian ancestry.
We then explore the possibility that the continental ancestry observed in both the Yayoi and Kofun periods derives from the same source, with intermediate levels of Northeast and East Asian ancestry (table S12). Only one candidate was found to better fit a two-way mixture for Kofun, a population of the Late Bronze Age and Iron Age individuals from the Yellow River basin (YR_LBIA) (20), although this was not consistent across the reference sets (nested, P = 0.100; table S13). Despite not showing statistically significant gene flow with Yayoi to the exclusion of Jomon (Z = 2.487) (Fig. 4A and fig. S16), we find that a two-way model between YR_LBIA and Jomon also fits the Yayoi (table S14). This Yellow River population has an intermediate genetic profile with approximately 40% Northeast Asian and 60% East Asian (i.e., Han) ancestry, as estimated by qpAdm. Thus, this is an intermediate genetic profile that fits both Yayoi and Kofun in certain models, with an input of 37.4 ± 1.9% and 87.5 ± 0.8% in these populations (table S14). These results imply that continuous gene flow from a single source may be sufficient to explain the genetic changes between the Yayoi and Kofun.
However, our broader analyses strongly suggest that a single source of gene flow is less likely than two distinct waves of migrations. First, the ratios of Northeast Asian to East Asian ancestry identified in ADMIXTURE were starkly different between the Yayoi (1.9:1) and the Kofun (1:2.5) (Fig. 2C). Second, this contrast in continental affinity is also observable in the different forms of f statistics, in which there is a repeated pattern of Yayoi having significant affinity to those with Northeast Asian ancestry (Fig. 4A and fig. S16), while the Kofun individuals form a tight cluster with other East Asians including Han and ancient Yellow River populations (Fig. 5A and figs. S17 and S18). Last, we find support for a two-pulse model from our dating of the admixture in the Kofun individuals by DATES (fig. S20) (45). A single admixture event with the intermediate population (i.e., YR_LBIA) is estimated to have occurred 1840 ± 213 years before the present (B.P.), which is much later than the onset of the Yayoi period (~3 ka ago). In contrast, if two separate admixture events with two distinct sources are assumed, the resulting estimates reasonably fit the timings consistent with the beginning of the Yayoi and Kofun periods (3448 ± 825 years B.P. for the admixture between Jomon and Northeast Asian ancestry and 1748 ± 175 years B.P. for Jomon and East Asian ancestry; fig. S20). These genetic findings are further supported by both the archaeological evidence and the historical records, which document the arrival of new people from the continent during the period (1).
Genetic heritage of Kofun in present-day Japanese
The three Kofun individuals are genetically similar to the present-day Japanese, as shown in Fig. 2. This implies no substantial change in the genetic makeup of Japanese populations since the Kofun period. To look for signals of additional genetic ancestry in the present-day Japanese samples, we tested whether the continental populations have preferential affinity to modern genomes relative to Kofun using f4(Mbuti, X; Kofun, Japanese) (fig. S21). Although some of the ancient populations exhibit higher affinity to Kofun than Japanese, none of them is supported by qpAdm as an additional source of ancestry present in the Kofun (see note S3 and table S15). Unexpectedly, no ancient or modern population shows additional gene flow with the present-day Japanese to the exclusion of the Kofun. Our admixture modeling further confirms that the present-day Japanese population is sufficiently explained by Kofun ancestry without increasing Jomon or Yayoi ancestry or without introducing an additional ancestor represented by present-day Southeast or East Asians or Siberians (table S16). We also find that the modern Japanese population has the same set of ancestral components as the three-way admixture in the Kofun individuals (table S17), with a slightly increased level of East Asian ancestry in the modern Japanese compared with the Kofun individuals sampled (fig. S22). This suggests a certain level of genetic continuity but not absolute. A strict model of continuity between the Kofun and the modern Japanese population (i.e., with no genetic drift unique to the Kofun lineage) is rejected (table S18) (46). However, we note no dilution of Jomon ancestry in the Japanese population (15.0 ± 3.8%), relative to the Kofun individuals (13.1 ± 3.5%) (fig. S22), as opposed to the preceding Yayoi and Kofun periods where Jomon ancestry significantly decreased due to the continental migrations (Figs. 4 and 5). Testing the genetic cladality between Kofun and Japanese by qpAdm with a “no admixture” model, we found that Kofun forms a clade with Japanese (P = 0.769). These results suggest that the genetic profile of three major ancestral components established by the state formation period has become a foundation for present-day Japanese populations, as also supported from dental and nonmetrical cranial traits (47, 48).
DISCUSSION
Our data provide evidence of a tri-ancestry structure for present-day Japanese populations (Fig. 6), refining the established dual-structure model of admixed Jomon and Yayoi origins (5). The Jomon accumulated their own genetic variation due to long-term isolation and strong genetic drift within the Japanese archipelago following the LGM, which underlies a unique genetic component within the modern Japanese. The Yayoi period marks the end of this isolation, with substantial population migration from mainland Asia beginning at least 2.3 ka ago. However, we find a clear genetic distinction between the groups of people who arrived to the archipelago during the subsequent agrarian and state formation phases of Japanese pre- and protohistory. Genetic data from the Yayoi individuals document the presence of Northeast Asian ancestry in the archipelago as supported from morphological studies (5, 49), while we observe widespread East Asian ancestry in the Kofun. The ancestors characterizing each of the Jomon, Yayoi, and Kofun cultures made a significant contribution to the formation of Japanese populations today.

The lineage ancestral to Jomon is proposed to have originated in Southeast Asia with a deep divergence from other ancient and present-day East Asians (12–14). The timing of this divergence was previously estimated to be between 18 and 38 ka ago (14); our modeling with the ROH profile of the 8.8-ka-old Jomon individual narrows this date to a lower limit within the range of 20 to 15 ka ago (Fig. 3). The Japanese archipelago had become accessible through the Korean Peninsula at the beginning of the LGM (28 ka ago) (34), enabling population movements between the continent and archipelago. The subsequent widening of the Korea Strait 17 to 16 ka ago due to rising sea levels may have led to the isolation of the Jomon lineage from the rest of the continent and also coincides with the oldest evidence of Jomon pottery production (2). Our ROH modeling also shows that the Jomon maintained a small effective population size of ~1000 during the Initial Jomon period, and we observe very little changes to their genomic profile in subsequent periods or across the different islands of the archipelago.
The spread of agriculture is often marked by population replacement, as documented in the Neolithic transition throughout most of Europe, with only minimal contributions from hunter-gatherer populations observed in many regions (37–40). However, we find genetic evidence that the agricultural transition in prehistoric Japan involved the process of assimilation, rather than replacement, with almost equal genetic contributions from the indigenous Jomon and new immigrants at the Kyushu site (Fig. 4). This implies that at least some parts of the archipelago supported a Jomon population of comparable size to the agricultural immigrants at the beginning of the Yayoi period, as it is reflected in the high degree of sedentism practiced by some Jomon communities (50–53).
The continental component inherited by the Yayoi is best represented in our dataset by the Middle Neolithic and Bronze Age individuals from the West Liao River basin with a high level of Amur River ancestry (i.e., WRL_BA_o and HMMH_MN) (20). Populations from this region are genetically heterogeneous in time and space (20). The Middle-to-Late Neolithic transition (i.e., between 6.5 and 3.5 ka ago) is characterized with an increase in Yellow River ancestry from 25 to 92% but a decrease in Amur River ancestry from 75 to 8% over time, which can be linked to an intensification of millet farming (20). However, the population structure changes again in the Bronze Age, which started around 3.5 ka ago, due to an apparent influx of people from the Amur River basin (fig. S17) (20). This coincides with the beginning of intensive language borrowing between Transeurasian and Sinitic linguistic subgroups (54). Excess affinity to the Yayoi is observable in the individuals who are genetically close to ancient Amur River populations or present-day Tunguisic-speaking populations (Fig. 4 and fig. S17). Our findings imply that wet rice farming was introduced to the archipelago by people who lived somewhere around the Liaodong Peninsula but who derive a major component of their ancestry from populations further north, although the spread of rice agriculture originated south of the West Liao River basin (55).
The most noticeable archaeological characteristic of Kofun culture is the custom of burying the elite in keyhole-shaped mounds, the size of which reflect hierarchical rank and political power (1). The three Kofun individuals sequenced in this study were not buried in those tumuli (see note S1), which suggests that they were lower-ranking people. Their genomes document the arrival of people with majority East Asian ancestry to Japan and their admixture with the Yayoi population (Fig. 5 and fig. S17). This additional ancestry is best represented in our analysis by Han, who have multiple ancestral components. A recent study has reported that people became morphologically homogeneous in the continent from the Neolithic onward (56), which implies that migrants during the Kofun period were already highly admixed.
Several lines of archaeological evidence support the introduction of new large settlements to Japan, most likely from the southern Korean peninsula, during the Yayoi-Kofun transition. Strong cultural and political affinity between Japan, Korea, and China is also observable from several imports, including Chinese mirrors and coins, Korean raw materials for iron production (1), and Chinese characters inscribed on metal implements (e.g., swords) (57). Access to these resources from overseas brought about intensive competition between communities within the archipelago; this facilitated political contact with polities in the continent, such as the Yellow Sea coast, for dominance (1). Therefore, continuous migration and continental impacts are evident throughout the Kofun period. Our findings provide strong support for the genetic exchange involved in the appearance of new social, cultural, and political traits in this state formation phase.
There are caveats to this analysis. First, we are limited to only two Late Yayoi individuals from a region where skeletal remains associated with Yayoi culture are morphologically similar to Jomon (16). Yayoi individuals from other regions or other time points may have different ancestral profiles, e.g., continental-like or Kofun-like ancestry. Second, our sampling is nonrandom, as is the case of our three Kofun individuals coming from the same burial site (table S1). Additional ancient genomic data will be necessary to trace temporal and regional variation in the genetic ancestry of Yayoi and Kofun populations and provide a comprehensive view of the tripartite structure of Japanese populations proposed here.
In summary, our study provides a detailed look into the changing genomic profile of the people who lived in the Japanese archipelago, both before and after agricultural and technologically driven population movements ended thousands of years of isolation from the rest of the continent. Ancient genomics on individuals from these isolated regions provides a unique opportunity to observe the magnitude of the effects of major cultural transitions on the genetic makeup of human populations.
MATERIALS AND METHODS
Sampling
Petrous bones and a tooth from a total of 14 ancient Japanese individuals (11 Jomon and 3 Kofun) from six archaeological sites across the west and central parts of the Japanese archipelago were sampled. Detailed information of each site is provided in note S1, including archaeological contexts and radiocarbon dates that are taken from OxCal4.4 (58) with the IntCal20 curve.
DNA extraction
Sample processing was carried out in dedicated ancient DNA facilities at Kanazawa University and Trinity College Dublin where all the precautions for ancient DNA processing were followed as described in (59). Samples were photographed extensively before further processing. All bones were exposed to ultraviolet light for 15 min on either side to remove surface contaminants. Further cleaning of their surface was performed with a drill before extraction. A triangular wedge section of the otic capsule region of the petrous temporal bone was targeted for sampling. Half of the wedge or fragmented tooth was pulverized for DNA extraction. An aliquot of ~0.1 g of the bone powder was subjected to a silica column method with or without an initial washing step by 0.5% bleach solution as in (60) or by predigestion solution as in (61). DNA extracts were purified with MinElute silica columns (QIAGEN) and eluted at a volume of 55 μl of elution buffer.
Library preparation and sequencing
The initial screening of each sample and blank controls was performed by constructing a double-stranded DNA next-generation sequencing library mainly using the method outlined in (62) with modifications as in (38) but also using a NEBNext Ultra II DNA Library Prep Kit for Illumina with bead-based size selection [<100 base pairs (bp)]. Every library was screened on a MiSeq Illumina platform. DNA extracts with human endogenous content of >20% were selected for high-coverage sequencing and subsequently treated with uracil-DNA-glycosylase (UDG) (63) before a second library construction with the former method. To increase complexity when sequencing for high-coverage, several polymerase chain reactions (PCRs) with unique indexes were prepared from each UDG-treated library. Different PCR cycles were used according to the template concentration. The concentration and quality were then assessed using the Agilent TapeStation 2200 system with the D1000 ScreenTape. High-coverage sequencing for UDG-treated libraries from 12 individuals was carried out on a HiSeq 2500 or NovaSeq 6000 Illumina platform (100-bp single-end reads or 50-bp paired-end reads) at Macrogen (Republic of Korea) or TrinSeq (Ireland).
Sequence data processing
We trimmed adapters from raw single-end sequence reads using cutadapt v1.9.1 (64) with a minimum overlap of 1 bp and removed sequences shorter than 34 bp in length and from raw paired-end sequence reads using AdapterRemoval v2.2.2 (65) with the following parameters: --collapse --minlength 25 --minadapteroverlap 1 --minquality 25--trimns and --trimqualities. The trimmed reads were aligned to the hg19 reference genome with the revised Cambridge Reference Sequence (rCRS) for mitochondrial DNA (mtDNA) using bwa-aln in BWA (Burrows-Wheeler Aligner) v0.7.5 (66) with relaxed parameters “-l 16500 -n 0.01 -o 2.” We applied a mapping quality of 20 to the aligned data and removed PCR duplicates using SAMtools v1.7 (67). The authenticity of ancient DNA was determined in non–UDG-treated libraries by looking at degradation patterns at 5′- and 3′-end, respectively, using mapDamage2.0 (68). We added read groups using Picard tools version 1.101 (http://broadinstitute.github.io/picard/), before all libraries were merged into one bam per individual. Two final processing steps were carried out on the merged files: Indels were realigned using Genome Analysis Toolkit (GATK) version 3.7-0 (69), and the quality of the two bases at the end of each read was manually reduced to a score of 2 (“softclipped”), to avoid calling genotype from these damage-prone regions. We used the same processing pipeline for published ancient genomes in FASTQ format with the exception of using AdapterRemoval version 2.2 (65) instead of cutadapt; in some cases, BAM files were realigned to our reference genome and then put through the same pipeline. Quality assessment of raw data was conducted with FastQC v0.11.4 (70).
Contamination estimates and determining mtDNA haplogroup
To determine the mitochondrial contamination rate and assign a mitochondrial haplogroup, we aligned sequence reads to the rCRS mitochondrial genome and reprocessed the aligned data using the same pipeline described in the previous section. Consensus sequences were determined to a minimum depth of consensus of 5 and a base quality of 30 using mpileup and bcftools within the SAMtools package. We then assigned a specific haplotype to each consensus sequence using HAPLOFIND (71).
We estimated contamination rates as previously described in (33): Briefly, we calculated the rate of secondary bases that did not match the consensus sequence at haplotype-defining and private mutations defined by HAPLOFIND. We also report the rate when removing single-nucleotide polymorphisms (SNPs) marked as C or G that may be due to postmortem damage (table S2).
Molecular sex determination and relatedness
To determine the sex of each of our ancient samples, we filtered for reads with a minimum mapping quality of 30 and followed the method outlined in (72). In summary, we calculated the ratio of Y chromosome reads to the total number of sex chromosome (Ry) (72) and assigned female if Ry < 0.016 or male if Ry > 0.075 (table S3). The kinship estimation for all ancient individuals was done using “Relationship Estimation from Ancient DNA” (READ) (73). Any first-degree relatives were removed from analysis.
Y chromosome haplogroup analysis
All newly sequenced individuals determined to be male were piled-up using GATK version 3.7-0 (69) and manually compared to the International Society of Genetic Genealogy (ISOGG) SNP index with a mapping quality of 20 and a base quality of 30.
Genotype calling and merging to published datasets
We created a large panel of ancient East Eurasians that include ancient Japanese newly sequenced in this study and published ancient genomes from Central and Eastern Steppe, Siberia, Southeast Asia, and East Asia (see a full list of ancient individuals in table S4). We genotyped all ancient individuals for the biallelic SNP sites present on two different reference panels in which they were merged to the following: (i) the Human Origin Array (HOA) consisting of 594,896 SNP sites for 1963 modern, ancient, and reference genomes (39); and (ii) the SGDP consisting of 278 modern, ancient, and reference genomes (27) that have been filtered for autosomal transversion-only SNPs with a minor allele frequency of 1%, which left 3,867,366 SNP sites in our merged data. For each SNP site, we randomly called a high-quality single base (bq30) per position to create a pseudo-diploid genotype using GATK version 3.7-0 (69).
Principal components analysis
PCA was conducted using the smartpca (v16000) from the EIGENSOFT package (v7.2.0) (74) We projected all ancient Japanese and a subsection of other ancient individuals onto present-day East Eurasians in the SGDP panel (n = 112), filtered for transversions and global minor allele frequencies of 1%, with the options of “killr2: YES,” “r2thresh: 0.2,” “numoutlieriter: 0,” “lsqproject: YES,” and “autoshrink: YES.” With the exception of “Yayoi_1,” we included ancient individuals with a coverage of at least 100,000 SNPs.
ADMIXTURE
We used ADMIXTURE v.1.3.0 (75) for unsupervised genetic clustering of ancient East Eurasian samples with at least 100,000 SNPs in the SGDP dataset (n = 189) and present-day populations from the HOA (n = 786; Mbuti, Sardinian, South Asians, Southeast Asians, East Asians, Siberians, Oceanians, and Native Americans). SNPs were pruned for sites in linkage disequilibrium using PLINK v1.90b4.4 (76), with a sliding window size of 50 variants, a step size of 5 variants, and an r2 threshold of 0.2 (--indep-pairwise 50 5 0.2), leaving 186,856 SNPs for analysis. We ran 10 replicates with random seeds for the number of clusters (K) from 2 to 12 and chose the run with the minimum cross-validation error for plotting.
TreeMix analysis
Maximum likelihood trees were inferred under various admixture models using TreeMix (v1.13) (29). A subset of ancient and present-day populations in the SGDP dataset was chosen to represent different ancestors across East Eurasia: Ust_Ishim, Yana_UP, MA1, Tianyuan, Salkhit, Papuan, Hoabinhian (La368 and Ma911), Kusunda, Jomon, Chokhopani, Shamanka_EN, Lokomotiv_EN, DevilsCave_N, USR1, Han, Ami, and Japanese. The dataset was filtered for nonmissingness, which left 98,687 SNPs for analysis. We used Mbuti as an outgroup to root the tree and fitted models with no-migration or migrations from one to five to the data. Total 1000 to 1500 replicates were run for each model, of which the tree with a likelihood of the closest to a mean across the replicates was considered the most representative under a given model.
F statistics
We calculated f statistics using qp3Pop (v300) and qpDstat (v662) with the f4 mode in the AdmixTools v6.0 package (77). We used outgroup f3 statistics to measure a genetic relationship between two populations or between all pairs of individuals within a population by specifying Mbuti as an outgroup. SEs in f4 statistics were calculated from the default block jackknife approach.
Diploid calling and determining ROHs
We used HaplotypeCaller, part of GATK version 3.7.0, to call diploid genotypes for the oldest Jomon, JpKa6904, and other published high-coverage ancient genomes, including Yana1 (19), USR1 (78), Loschbour, Stuttgart_LBK (39), Mesolithic Irish (SRA62), and Neolithic Irish (JP14) (33). Our diploid call was based on the 1000 Genome phase 3 release v5 panel (28) filtered for transversion sites and a minor allele frequency of 1%. We used VCFtools v0.1.13 (79) to filter our results for a genotype quality of 30 and a minimum depth of 10. Transversion SNPs common to each diploid ancient sample (total of 660,027 SNPs) were used for this analysis. ROHs were measured in each diploid genome using PLINK v1.90b4.4 (76) with the following options: -homozyg --homozyg-density 50 --homozyg-gap 100 --homozyg-kb 500 --homozyg-snp 50 --homozyg-window-het 1 --homozyg-window-snp 50 --homozyg-window-threshold 0.05.
Demographic modeling with ROH
To estimate the population size (N) and split time (T) of the Jomon lineage, we applied coalescent simulations of the Out-of-Africa model (80) to approximating a likelihood surface by fitting genome-wide patterns of ROHs to those observed in our oldest Jomon individual, JpKa6904 (see note S2). Briefly, we first measured the proportion of the Jomon genome under ROH using PLINK v1.90b4.4 (76). Second, we conducted coalescent simulations under different combinations of N and T using ms (81), with an option of “-eA” that allows sampling of ancient chromosomes at a given time in the past. We then fitted the spectrum of ROH fragments ranging from 0.5 to 100 Mb.
We broadly searched for the parameter space from all combinations of 500 ≦ N ≦ 2500 and 10 ≦ T ≦ 40 ka ago using the data from chromosome 3 to 22. Narrowing down the parameter space that includes likely scenarios, we evaluated the goodness-of-fit of the models with the full genome data (i.e., chromosomes 1 to 22). Fitting of the model was measured as an approximate Bayes factor (aBF) (82) where the model with the highest likelihood was compared to each of all other models. We considered log10-scaled aBF > 2.0 as decisive evidence on the data in favor of the highest likelihood model, as opposed to the other model (83).
qpWave and qpAdm modeling
To model admixture events in the prehistory of Japan, we applied qpWave v600 and qpAdm v1000 in the AdmixTools v6.0 package to the merged datasets of ancient East Eurasians and the SGDP populations (77, 84). Our analysis only used transversion sites with global minor allele frequencies of >1%, coupled with the option of “allsnps: YES.” We used a set of nine Eurasian populations, including Sardinian (n = 3), Kusunda (n = 2), Papuan (n = 14), Dai (n = 4), Ami (n = 2), Naxi (n = 3) (27), Tianyuan (n = 1) (85), Chokhopani (n = 1) (18), and Mal’ta (n = 1) (86), as an outgroup with or without a subset of Jomon individuals (JpKa6904, JpOd181, and IK002) in our modeling. We considered populations as sources of an admixture event only if the admixture between the sources is supported from modeling with and without a subset of Jomon in the right populations.
Dating admixture events by DATES
We used DATES v753 (45) to estimate the time of two different admixture events in the Kofun individuals: one is the admixture between the Jomon and Northeast Asian ancestry, and the other is between the Jomon and East Asian ancestry. For the former model, we used the West Liao River individuals labeled as WLR_BA_O and HMMH_MN as the second source. East Asian ancestry in the latter model was represented by Han Chinese in Beijing, China (CHB) in the 1000 Genome phase 3 data (28). The estimated date in generation was converted into years with the assumption of 25 years per generation, which was further added into a mean age of median dates from three Kofun individuals (i.e., 1348 years before present). The parameter settings that we used are as follows: binsize: 0.001, maxdis: 1.0, runmode: 1, mincount: 1, and lovalfit: 0.45. The SE was estimated from a weighted block jackknife method.
Acknowledgments
We thank M. Ono (Kurashiki City), M. Asano (Kurashiki City), Y. Yoshioka (National Museum of Japanese History), and H. Mukai (Kanazawa City) for help in provision of samples. We also would like to thank A. Town for curation and management of human skeletons derived from JpHi01. We acknowledge Kanazawa University and TrinSeq in Trinity College Dublin for MiSeq sequencing and the Irish Centre for High-End Computing (ICHEC) for the provision of computational facilities and support. We would also like to thank the anonymous reviewers for their constructive feedback. Funding: This work was funded by the Science Foundation Ireland/Health Research Board/Wellcome Trust Biomedical Research Partnership Investigator Award (no. 205072 to D.G.B., “Ancient Genomics and the Atlantic Burden”), CHOZEN Project in Kanazawa University (to T.G.), Wellcome Trust ISSF Award (to S.N.), Sumitomo Foundation Fiscal 2018 Grant For Basic Science Research Projects (no. 180207 to S.N.), and Japan Society for the Promotion of Science KAKENHI Grant (nos. JP20H05822 and JP18H00755 to T.G.; JP19K06871 and JP20H05129 to S.N.). Author contributions: D.G.B., T.G., and S.N. supervised the study. K.O., S.O., S.H., K.M., K.K., N.T., A.M., M.I., Y.K., and T.G. provided samples and assembled archaeological and anthropological information. V.M., C.A.S., and T.G. performed ancient DNA laboratory analysis. N.P.C., L.M.C., T.G., and S.N. processed and analyzed genetic data. N.P.C., V.M., L.M.C., D.G.B., T.G., and S.N. wrote the manuscript with input from all coauthors. Competing interests: The authors declare that they have no competing interests. Data and materials availability: Genome sequence data produced in this study are available at the European Nucleotide Archive (ENA) with accession number PRJEB43762 (www.ebi.ac.uk/ena/browser/view/PRJEB43762). All data needed to evaluate the conclusions in the paper are present in the paper and/or the Supplementary Materials.
Supplementary Materials
This PDF file includes:
Supplementary Text
Figs. S1 to S22
Tables S1 to S18
References
- DOWNLOAD
- 63.48 MB
REFERENCES AND NOTES
(1)eLetters
eLetters is a forum for ongoing peer review. eLetters are not edited, proofread, or indexed, but they are screened. eLetters should provide substantive and scholarly commentary on the article. Embedded figures cannot be submitted, and we discourage the use of figures within eLetters in general. If a figure is essential, please include a link to the figure within the text of the eLetter. Please read our Terms of Service before submitting an eLetter.
LOG IN TO SUBMIT A RESPONSE===
No comments:
Post a Comment